
Four contextual data cards
Choose weekly training distance, activity history, live health or weather trends for the modular middle row.
Context-rich performance dashboard
Graph your grind.
A neon performance dashboard where interchangeable data cards pair current values with trends, histories and goal progress.
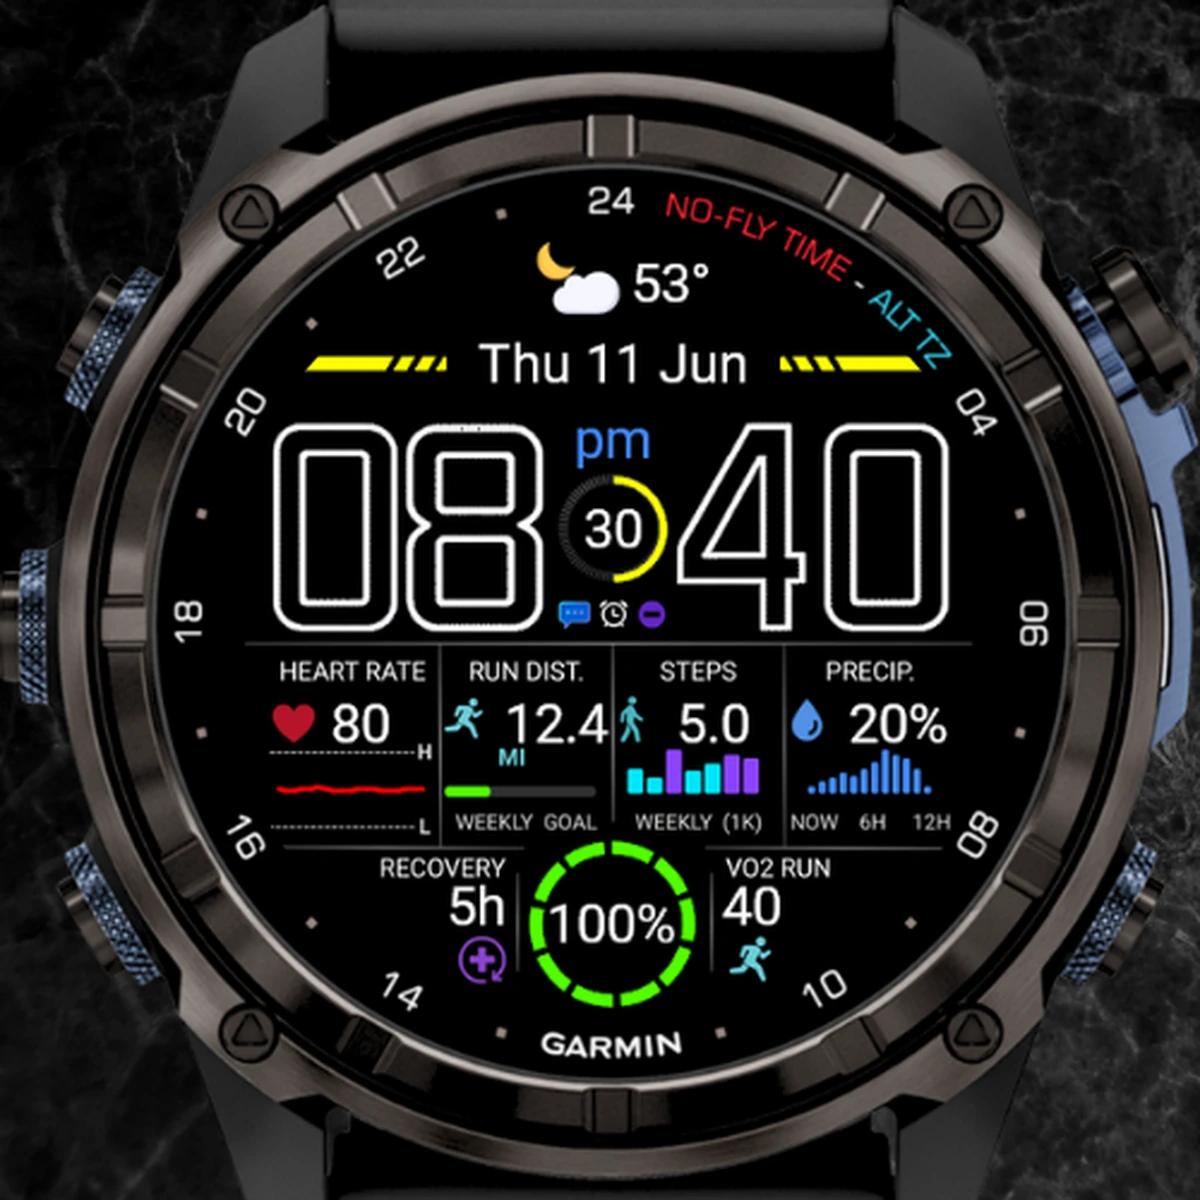
Choose weekly training distance, activity history, live health or weather trends for the modular middle row.
Weekly run and bike distance can be paired with personal goals using Garmin's supported complication data.
Heart rate, Body Battery, stress, steps and floors can be shown with recent trend or seven-day context.
Separate color profiles, custom fonts, units and on-device settings let the dashboard feel distinctly yours.
Why it exists
For active users who want a bold visual identity and deep daily context in the same layout.
01
Neon Pulse is intentionally more technical than Logos Modular. It rewards users who want to see how a value is moving, not only what it is right now.
02
Color, line weight and repeated card structures keep many data sources coherent.
03
The outlined time and bright accents create a high-energy look while the underlying structure remains readable.
Before installing
Product notes
Available now
Garmin shows the current compatible devices, store price and customer reviews.
View on Connect IQ ↗More from Data Is Beautiful
Graphs, modular layouts and trend-aware dashboards that make complex data easier to read.
 Published
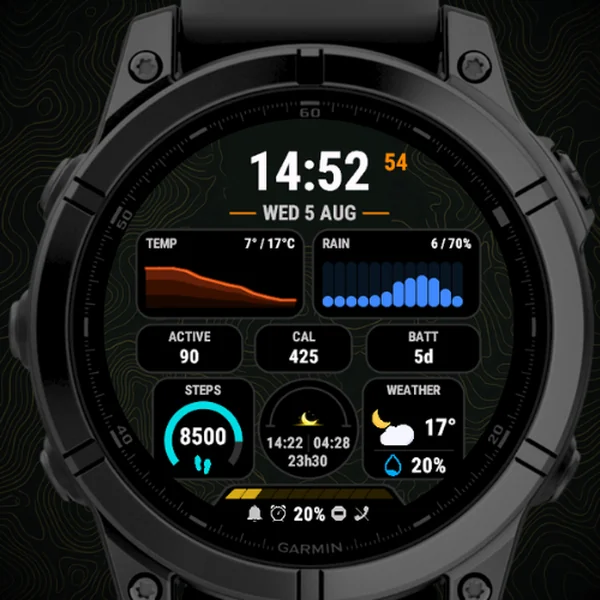
A rugged, data-rich modular watch face that combines trend graphs, goal gauges and outdoor-friendly readability in a layout built for both AMOLED and MIP devices.
 Published
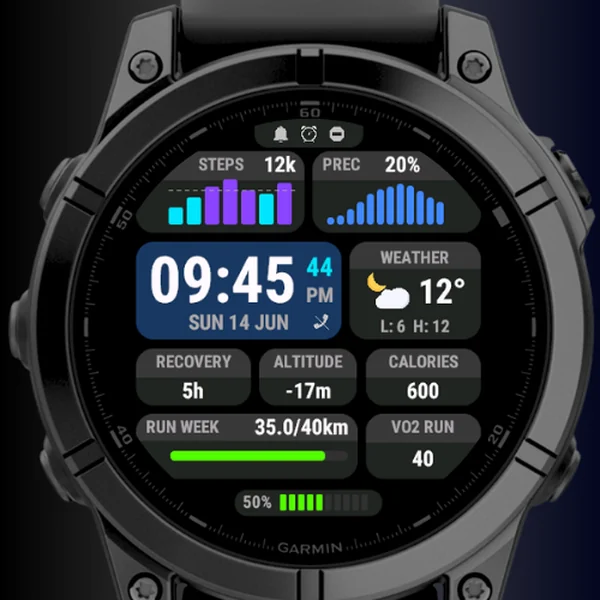
A dense but orderly modular watch face with two live graph slots, a smart goal gauge and five interchangeable data fields.